Lowering $1.7M in Support Call Costs with Data-Driven Design
Linksys is a networking company manufacturing smart routers. Customers needing product assistance can call a dedicated support line, handled by a call center in the Philippines.
Problems
Sales were declining year over year as the consumer router market shifted: the business needed to cut costs, fast
Annual Support Call Costs were at $1.7 million annually, and was trending up year over year
Solution
3 low-development features targeting popular customer support topics: An in-app troubleshooting wizard aggregating existing features in the app. A revamped FAQ section and Support Article content. Revealing mesh router RSSI data to encourage self-directed troubleshooting.
Results
$k
Estimated Savings in Annual Expenses
My involvement
Facilitating Cross-Department Brainstorming
Synthesizing Customer Data
UX/UI for 3 Solutions

Customer support is costly. Conducted at a call center in the Philippines, calls are billed at 18 cents per minute.
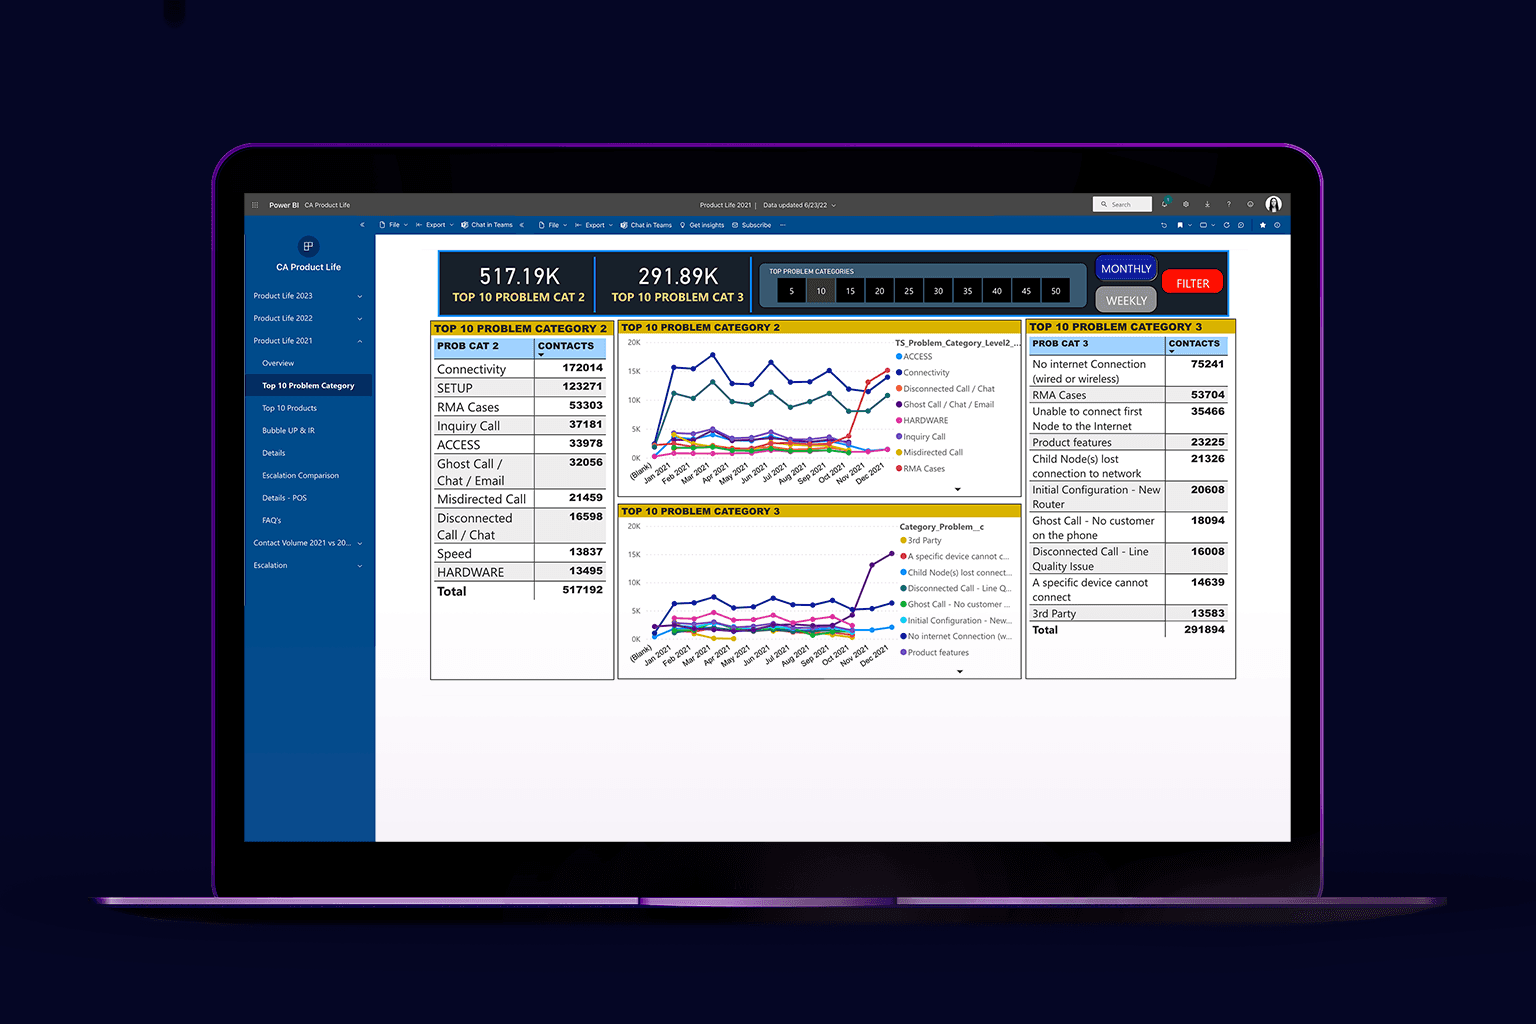
We track all Customer Support calls with a dashboard, tallying each call by topic and length.
The dashboard offered topics as a starting point, but meaningful solutions demanded deeper insight. Departments gathered for fast-paced, creative discussions, with a goal of 3 design solutions. The aim was maximum impact for the least amount of effort.


Huddling with team leads from Customer Support, Firmware and App engineering, QA, and our Data Analytics person: we created a list of ideas per support topic, rating the level of effort and its estimated impact.
By the end of the meeting, I had 3 solutions to execute.
Solution 1
Providing RSSI Data between Mesh Units

The first solution was the simplest, a matter of revealing each hardware unit's RSSI value (The signal strength in relation to other units.)
This gave users a data point to experiment with moving their nodes around the home for increased connectivity.
Solution 2
Revamping Support Articles

The next solution was updating the in-app help. Based on our app analytics, we knew users came to the app for troubleshooting network problems.
It was a simple FAQ format organized by topic, opening support articles in an in-app web browser.

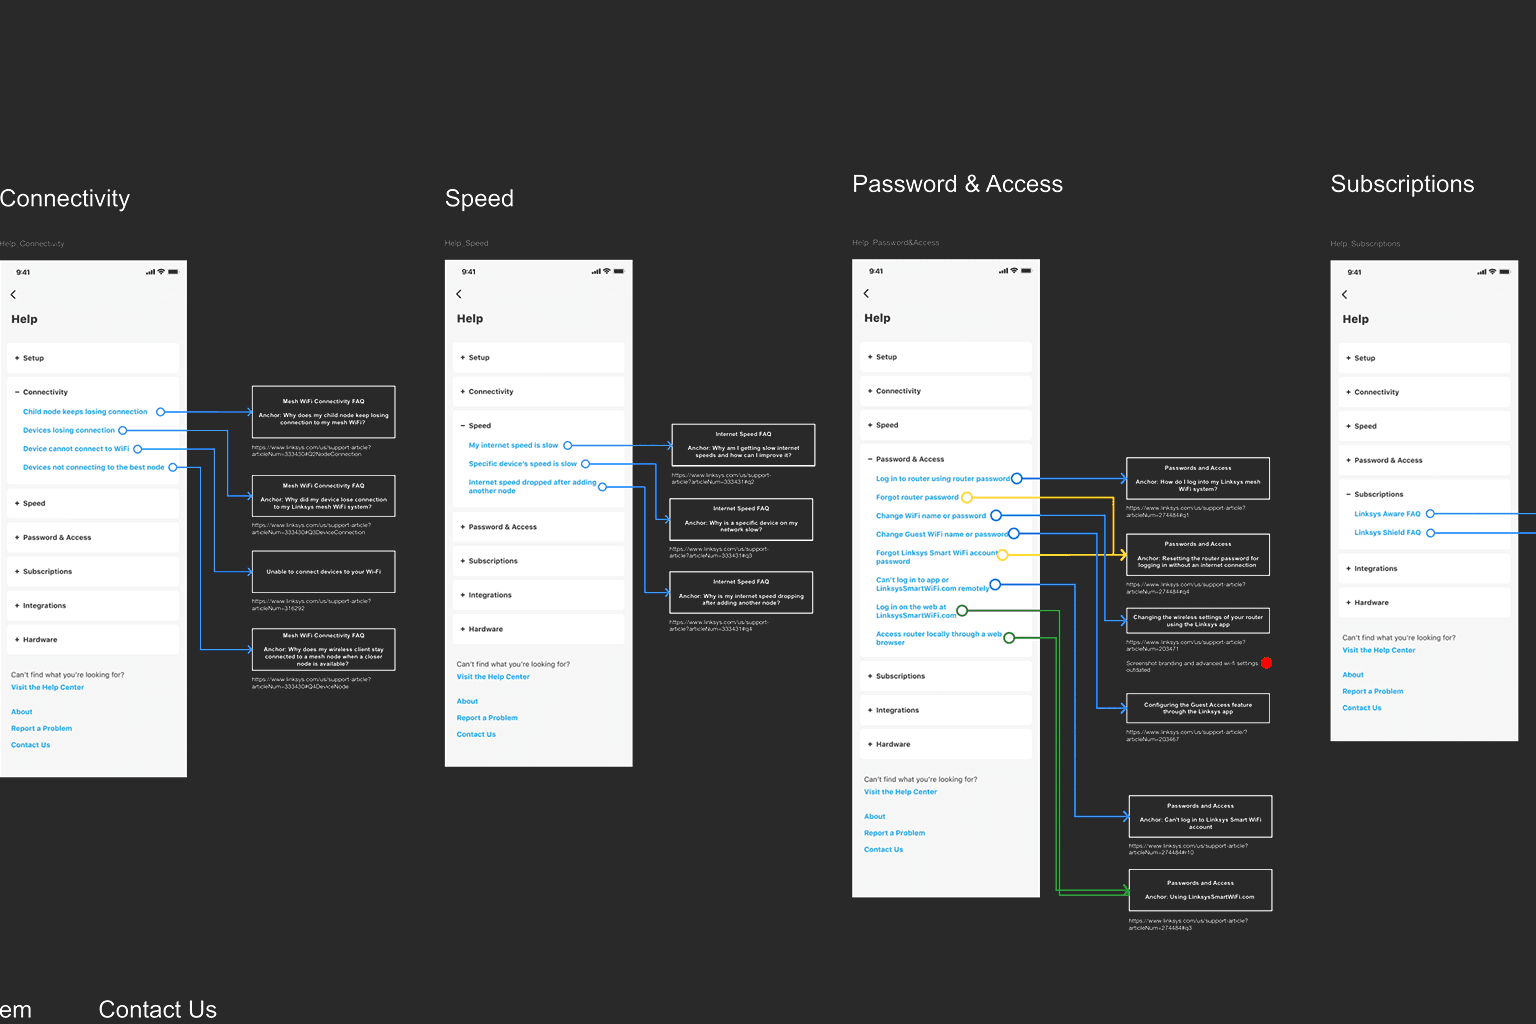
I was tasked with assessing how well the in-app Help aligned with our top support call topics.
While the design was simple, this took in-depth data synthesis and for updating the Support content.
Solution 3
In-app Troubleshooting Wizard

Solution 3 aggregated existing app features and common troubleshooting techniques (restarting your hardware) and put them in a linear, user-friendly wizard.
Recap
Results
$k
Estimated Savings in Annual Expenses
Following the support call-reduction app release, our data analyst reviewed the Power BI data at 32 and 100 days.
The data shows a sustained reduction in overall calls to support:
%
Drop in Setup-related calls (Top call-driver)
%
Drop in Node Connectivity-related calls (2nd highest call-driver)
%
Drop in other topics combined
Sometimes the simple and non-flashy solutions can make a big impact. Cross-department collaboration is a must for triaging the most effective changes. Data is vital investment in order to make informed decisions.